

Host Log Ingestion
Hello! The topic of today’s discussion is host log ingestion. Specifically enterprise host log ingestion and pipeline creation into a SIEM; which in this case will be SecurityOnion2.
What is host log ingestion? Well it’s important that we first define what host logs are. Host logs are logs taken by Windows/Linux systems that are stored locally. Depending on the auditing/configuration settings, these logs correspond with different values that show the effect those systems have. For example, if logging is configured properly everytime someone opens an app, everytme someone makes a configuration change, everytime some creates and deletes a file a log will be generated. Thus host log ingestion is just putting all of these logs into our singular SIEM.
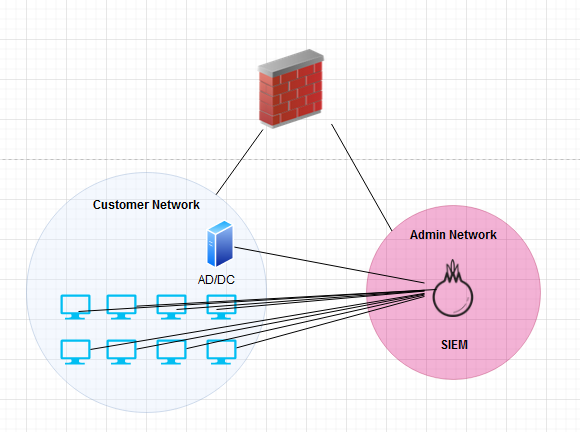
There are 2 main ways to receive these forwarded logs into a SIEM. The first is through collector initiated log aggregation where each node/computer sends its logs to the SIEM individually. This method is typically consider very cumbersome and bandwidth heavy and is not recommended due to the upkeep required of having to manually configure and monitor each host. Here is an example of what this may look like:
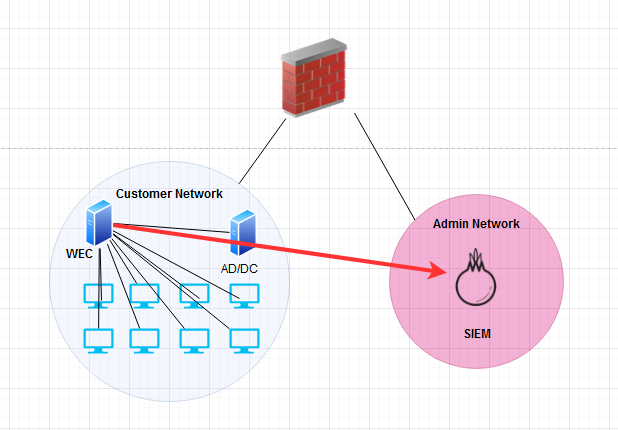
The other type of host log collection is source computer initiated where through group policy nodes are required to send their logs to a centralized server. This is preferable as it’s more scalable and their is less future overhead once you have it set up. An example of what this may look like is shown here:
As you can imagine this type of information is incredibly valuable for cyber defenders, which is why today I’ll be guiding you through the process of centralizing those logs, and pushing them up to a SIEM like example 2.
Prerequisites / Steps
Before we get started there are a couple of things you will need to have setup for this guide to be beneficial to you.
1
2
3
4
5
You will need to have a WEC joined to an already pre-existing domain.

You will need to have a SIEM already stood up and configured. My instructions will be based on SecurityOnion2, but you can use Splunk forwarders as well.

You will need VM's also joined to the domain to gather host logs from.
Once you’ve met those prerequisites you’re ready to move on!
In general there are 3 main components to configuring a centralized log ingestion pipeline.
Configure a WEC to ingest logs from all domain joined nodes.
Configure a group policy that forces those nodes and any nodes thereafter to be configured to send their logs to the previously configured WEC.
Configure additional forwarding via winlogbeat into our SIEM.
Configuring the WEC
Square one for this demonstration will be a fresh install of Windows Server 2019 that has been joined to a domain ggsec.com. Once you have logged into the domain follow these steps.
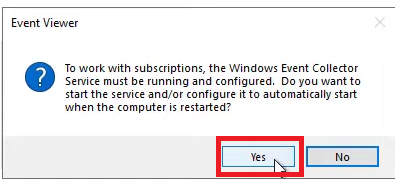
Go into Event Viewer and click Subscriptions.
a. You will get a pop-up window saying that the Windows Event Collector Service must be running and configured. Click yes to start this service.
For maximum performance you will want to increase the log size of the events that are ingested. Still in Event Viewer, go into Windows Logs and right-click on Forward Events and then click properties.
a. From here you will want to change the size of the maximum log size. The size will be dependent on the environment and the type of logs being ingested.
Next we will use Powershell to enable, automatically start event collection and a tweak in the way it ingests traffic. Open Powershell in an administrative shell and type the following:
1
winrm quickconfig -quiet
1
Set-Service -Name WINRM -StartupType Automatic
1
wevtutil sl forwardedevents /ms:1000000000
- By default, Windows Server 2016/2019 has firewall rules that block forwarded logs into these deployments so we will need to open them back up. You can do this by typing the following commands in a normal command prompt (not powershell) as an administrator.
netsh http delete urlacl url=http://+:5985/wsman/
netsh http add urlacl url=http://+:5985/wsman/ sddl=D:(A;;GX;;;S-1-5-80-569256582-2953403351-2909559716-1301513147-412116970)(A;;GX;;;S-1-5-80-4059739203-877974739-1245631912-527174227-2996563517)
netsh http delete urlacl url=https://+:5986/wsman/
netsh http add urlacl url=https://+:5986/wsman/ sddl=D:(A;;GX;;;S-1-5-80-569256582-2953403351-2909559716-1301513147-412116970)(A;;GX;;;S-1-5-80-4059739203-877974739-1245631912-527174227-2996563517)
Back in event viewer we will turn on the ability to push logs to this server. Right-click Subscription and click Create Subscription.
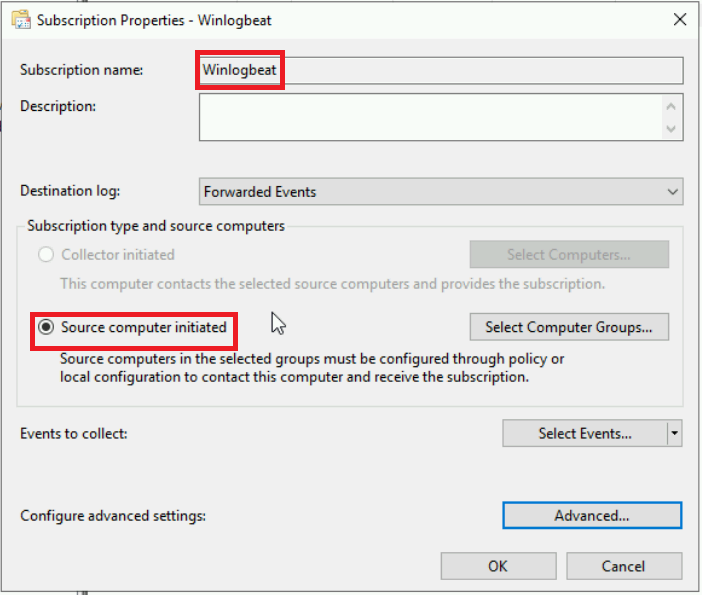
a. First give the subscription an appropriate name. Next you will want to change the radial button to Source computer initiated that way computers will send their logs to this server like we previously discussed.
![subscription]()
b. Next we are going to specify which computer we will send logs from. Click Select Computer Groups, then in the box I typed Domain Computers and Domain Controllers which covered every node in my domain.
NOTE For bigger production environments it’s reccommended to not exceed 4000 computers sending logs to 1 WEC and to instead stand up a WEC for every 4000 workstations. If this is your case, then you will need to create individual groups of 4000 machines and specify those here instead of all domain computers.
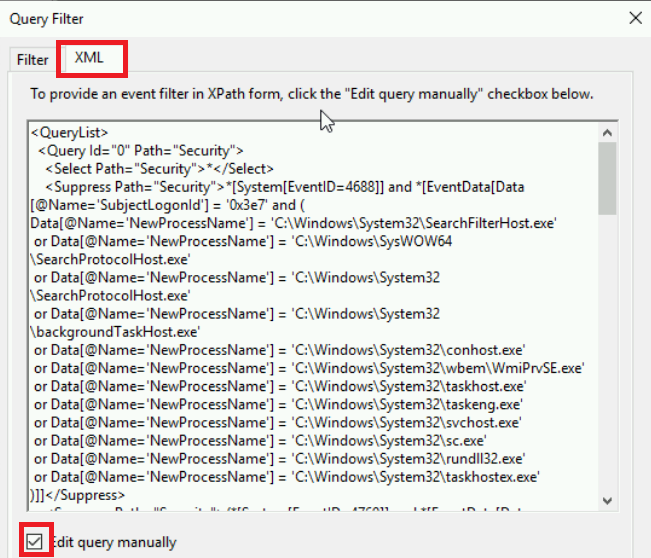
c. Next we will define which events we want to collect. Best practice is to put this into XML format. Click on the XML tab ad the top and click the radial button to edit the query manually. Once you do this you won’t be able to go back to filtered queries but that shouldn’t be a problem.
![xml]()
Here I input a sample query from SANS that will be a good starting point but always do further configuration based off the needs of your situation/mission.
1
2
3
4
5
6
7
8
9
10
11
12
13
14
15
16
17
18
19
20
21
22
23
24
25
26
27
28
29
30
31
32
33
34
35
36
37
38
39
40
41
42
43
44
45
46
47
48
49
50
51
52
53
54
55
56
57
58
59
60
61
62
63
64
65
66
67
68
69
70
71
72
73
74
75
76
77
78
79
80
81
82
<QueryList>
<Query Id="0" Path="Security">
<Select Path="Security">*</Select>
<Suppress Path="Security">*[System[EventID=4688]] and *[EventData[Data[@Name='SubjectLogonId'] = '0x3e7' and (
Data[@Name='NewProcessName'] = 'C:\Windows\System32\SearchFilterHost.exe'
or Data[@Name='NewProcessName'] = 'C:\Windows\SysWOW64\SearchProtocolHost.exe'
or Data[@Name='NewProcessName'] = 'C:\Windows\System32\SearchProtocolHost.exe'
or Data[@Name='NewProcessName'] = 'C:\Windows\System32\backgroundTaskHost.exe'
or Data[@Name='NewProcessName'] = 'C:\Windows\System32\conhost.exe'
or Data[@Name='NewProcessName'] = 'C:\Windows\System32\wbem\WmiPrvSE.exe'
or Data[@Name='NewProcessName'] = 'C:\Windows\System32\taskhost.exe'
or Data[@Name='NewProcessName'] = 'C:\Windows\System32\taskeng.exe'
or Data[@Name='NewProcessName'] = 'C:\Windows\System32\svchost.exe'
or Data[@Name='NewProcessName'] = 'C:\Windows\System32\sc.exe'
or Data[@Name='NewProcessName'] = 'C:\Windows\System32\rundll32.exe'
or Data[@Name='NewProcessName'] = 'C:\Windows\System32\taskhostex.exe'
)]]</Suppress>
<Suppress Path="Security">(*[System[EventID=4769]] and *[EventData[Data[@Name='ServiceName'] = 'krbtgt']])
or (*[System[EventID=4770]])
or (*[System[EventID=4624]] and *[EventData[Data[@Name='LogonType'] = '3']])
or (*[System[EventID=4634]] and *[EventData[Data[@Name='LogonType'] = '3']])
</Suppress>
</Query>
<Query Id="1" Path="Application">
<Select Path="Application">*</Select>
</Query>
<Query Id="2" Path="System">
<Select Path="System">*</Select>
</Query>
<Query Id="3" Path="Microsoft-Windows-Sysmon/Operational">
<Select Path="Microsoft-Windows-Sysmon/Operational">*</Select>
</Query>
<Query Id="4" Path="Microsoft-Windows-PowerShell/Operational">
<Select Path="Microsoft-Windows-PowerShell/Operational">*</Select>
</Query>
<Query Id="5" Path="Windows PowerShell">
<Select Path="Windows PowerShell">*[System[EventID=400]] or *[System[EventID=600]] or *[System[EventID=800]]</Select>
</Query>
<Query Id="6" Path="Microsoft-Windows-WMI-Activity/Operational">
<Select Path="Microsoft-Windows-WMI-Activity/Operational">*[System[EventID=5857]] or *[System[EventID=5858]] or *[System[EventID=5859]] or *[System[EventID=5860]] or *[System[EventID=5861]]</Select>
</Query>
<Query Id="7" Path="Microsoft-Windows-TaskScheduler/Operational">
<Select Path="Microsoft-Windows-TaskScheduler/Operational">*</Select>
</Query>
<Query Id="8" Path="Microsoft-Windows-TerminalServices-RDPClient/Operational">
<Select Path="Microsoft-Windows-TerminalServices-RDPClient/Operational">*</Select>
</Query>
<Query Id="9" Path="Microsoft-Windows-TerminalServices-LocalSessionManager/Admin">
<Select Path="Microsoft-Windows-TerminalServices-LocalSessionManager/Admin">*</Select>
</Query>
<Query Id="10" Path="Microsoft-Windows-TerminalServices-LocalSessionManager/Operational">
<Select Path="Microsoft-Windows-TerminalServices-LocalSessionManager/Operational">*</Select>
</Query>
<Query Id="11" Path="Microsoft-Windows-GroupPolicy/Operational">
<Select Path="Microsoft-Windows-GroupPolicy/Operational">*</Select>
</Query>
<Query Id="12" Path="Microsoft-Windows-DriverFrameworks-UserMode/Operational">
<Select Path="Microsoft-Windows-DriverFrameworks-UserMode/Operational">*[System[EventID=2003]] or *[System[EventID=2004]] or *[System[EventID=2102]]</Select>
</Query>
<Query Id="13" Path="Microsoft-Windows-AppLocker/EXE and DLL">
<Select Path="Microsoft-Windows-AppLocker/EXE and DLL">*</Select>
<Select Path="Microsoft-Windows-AppLocker/MSI and Script">*</Select>
</Query>
<Query Id="14" Path="Microsoft-Windows-AppLocker/Packaged app-Execution">
<Select Path="Microsoft-Windows-AppLocker/Packaged app-Execution">*</Select>
</Query>
<Query Id="15" Path="Microsoft-Windows-AppLocker/Packaged app-Deployment">
<Select Path="Microsoft-Windows-AppLocker/Packaged app-Deployment">*</Select>
</Query>
<Query Id="16" Path="Microsoft-Windows-SmartCard-Audit/Authentication">
<Select Path="Microsoft-Windows-SmartCard-Audit/Authentication">*</Select>
</Query>
<Query Id="17" Path="Microsoft-Windows-SMBClient/Operational">
<!-- get all UNC/mapped drive successful connection -->
<Select Path="Microsoft-Windows-SMBClient/Operational">*[System[(EventID=30622 or EventID=30624)]]</Select>
</Query>
<Query Id="41" Path="Microsoft-Windows-Windows Defender/Operational">
<!-- Modern Windows Defender event provider Detection events (1006-1009) and (1116-1119) -->
<Select Path="Microsoft-Windows-Windows Defender/Operational">*[System[( (EventID >= 1006 and EventID <= 1009) )]]</Select>
<Select Path="Microsoft-Windows-Windows Defender/Operational">*[System[( (EventID >= 1116 and EventID <= 1119) )]]</Select>
</Query>
</QueryList>
The last thing you will want to is click the advanced button and make sure you click the radial button to Minimize Latency and set the protocol to HTTP.
NOTE While I know it may seem like we’ll be sending the logs unencrypted, due to the way kerberos and AD works, they will be encrypted, however the pipe sending them won’t be. It will be up to your risk tolerance if you do decide to encrypt your traffic.
That’s it for configuring our WEC. We will have to revisit the WEC later to configure Winlogbeat but we’ll go over that in a bit. Instead we’re going to switch gears and make sure we can actually forward the logs through group policies.
Configuring Group Policy
For the following steps you will want to login to the primary Active Directory server so that we can configure a group policy to forward host logs to the WEC we just created. Once logged into group policy you will want to do the following steps.
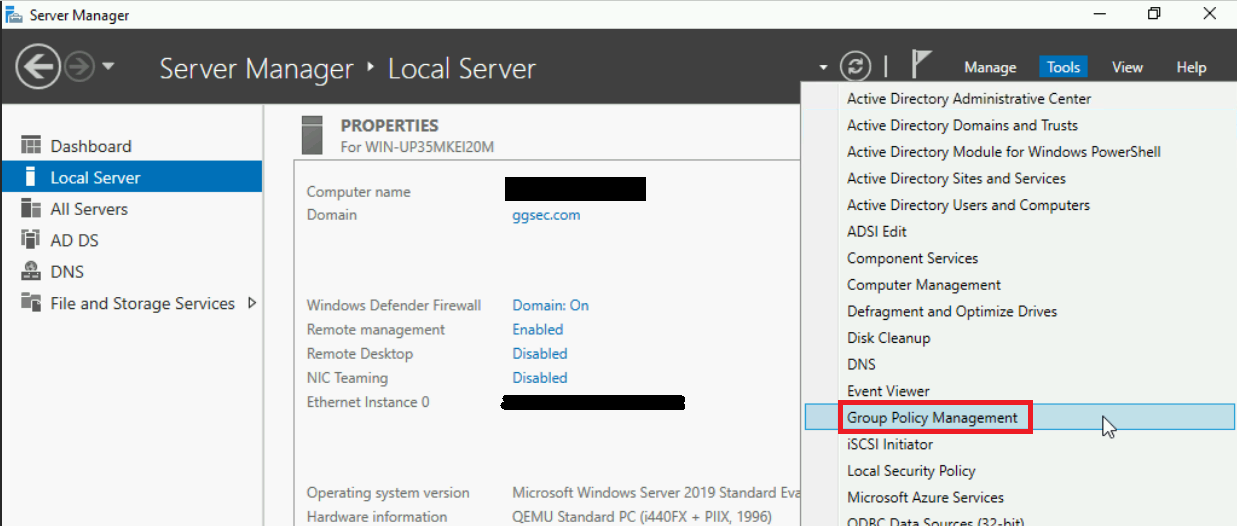
- In Server Manager, go to Tools > Group Policy Management.
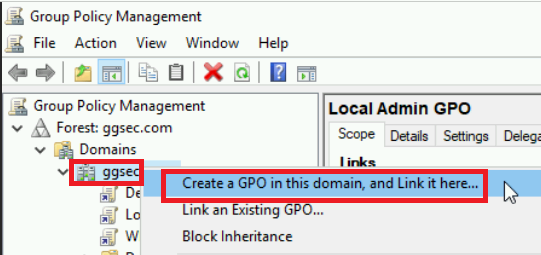
- From here you will want to expand your forest, expand your domains and the right-click your domain and click to create a new GPO.
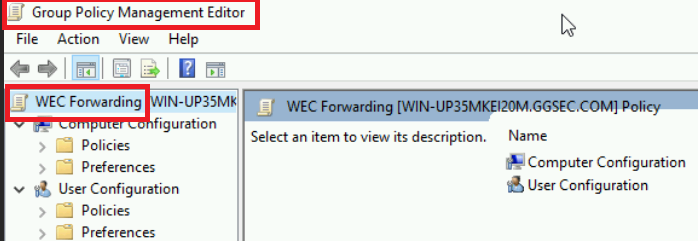
- You will be prompted to name your GPO, just name it something important. Then you will want to right-click your newely created policy and press edit. This will bring you to the Group Poilcy Management editor for this specific policy. Here I named my policy WEC Forwarding.
- From here you will first want to expand Computer Configuration > Windows Settings > Security Settings > Restricted Groups. Then you will want to right-click and add a new group.
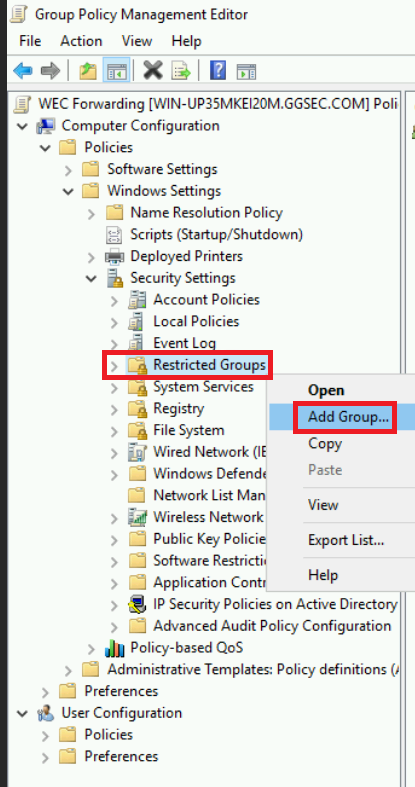
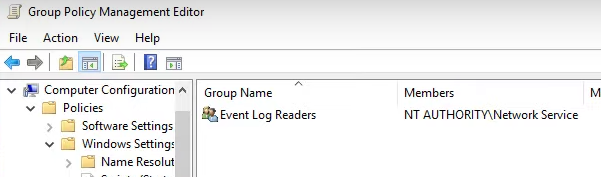
- Create a new name for the group and name it something appropriate. When adding members you will want to add NT AUTHORITY\Network Service.
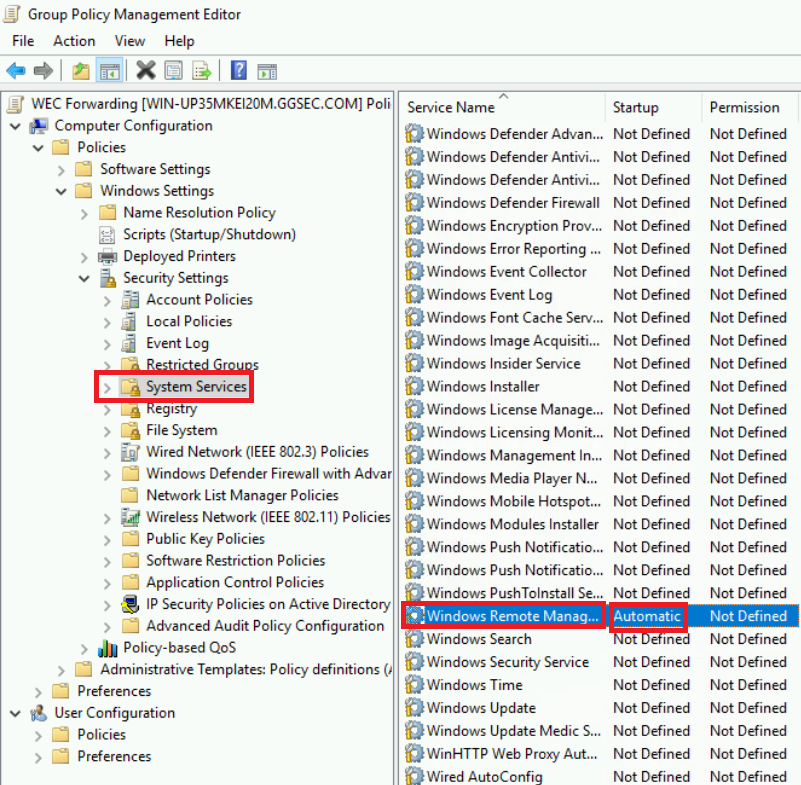
- You will then wan to edit System Services which is one down from your current position and make sure that Windows Remote Management is automatically started up on reboot. This keeps persistance for your hosts sending the logs.
- Next you will go under Computer Configurations > Policies > Administrative Templates: > Windows Components > Event forwarding. There will be 2 settings in here that we’re going to change. First you will want to right-click edit Configure forwarder resource usage. Make sure it’s set to Enabled and set the maximum forward rate. In a production server I would set this to around 1000.

- Next you will want to editt Configure target Subscription Manager. Make sure it’s set to Enabled as well and click Show under subscription manager. From here you will want to type this, replacing xxx with your WEC domain name.
1
Server=http://xxx:5985/wsman/SubscriptionManager/WEC,Refresh=120
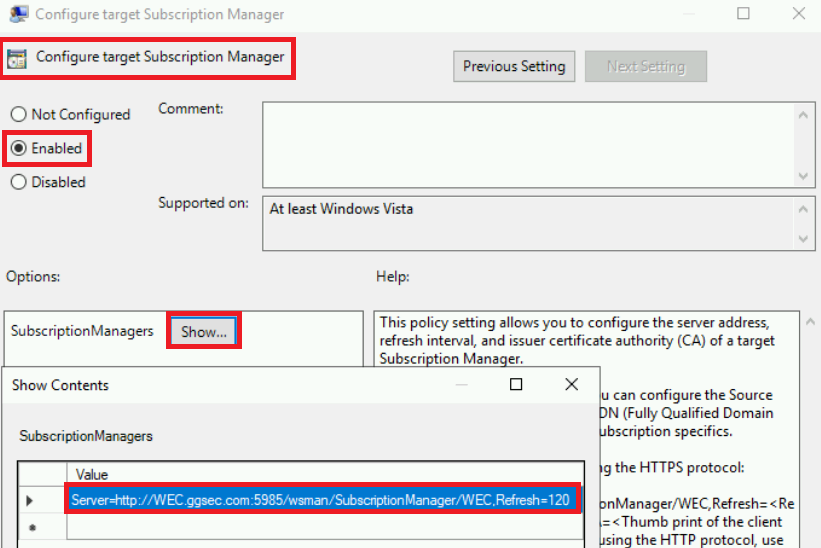
NOTE This will set the interval that hosts check for a configuration change every 2 minutes. If you know you won’t be changing your subscription often (like editing your XML query) then I would recommend increasing this amount. Additionally, if you want to encrypt over SSL you will want to set the port to :5986.
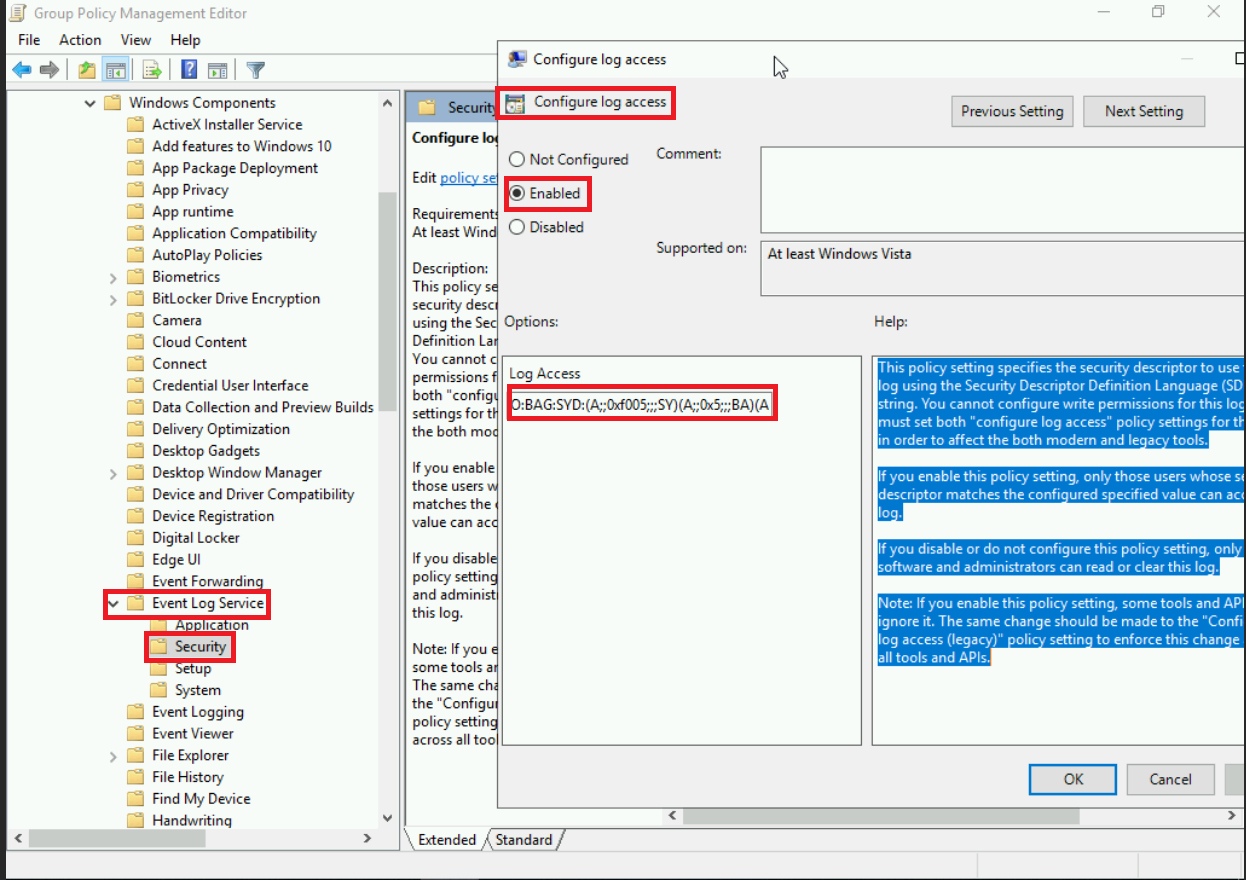
- Next you will go one more dowwn to Event Log Service, expand it and go to Security so we can edit Configure Log Access. This gives our WEC the ability to read the logs. Make sure it’s enabled and the type this into the Log Access Portion.
1
O:BAG:SYD:(A;;0xf0005;;;SY)(A;;0x5;;;BA)(A;;0x1;;;S-1-5-32-573)(A;;0x1;;;S-1-5-20)
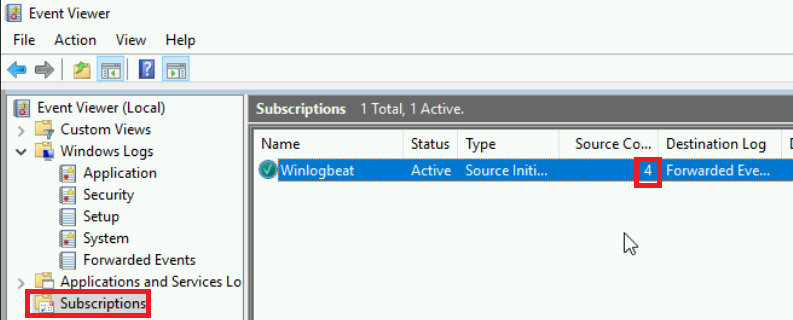
- After that setting we’re done configuring this group policy! From here you can close out all your windows and validate that the GPO is linked. Before the GPO will take affect however, we have to force an update to systems in our domain in order for them to start pushing logs. As an testing example, on a Windows10 host, I typed the following to update it’s policies and checked my WEC to see if that host was forwarding logs.
1
gpupdate /force
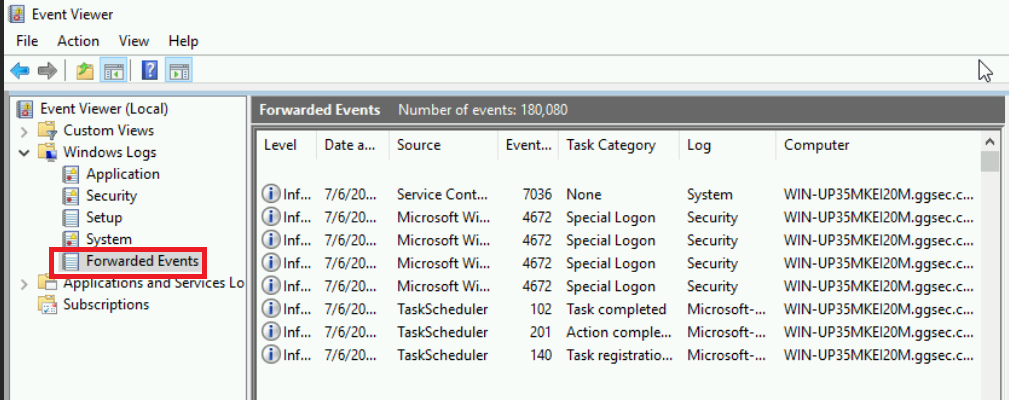
If you’ve made it to this point congrats, almost done! Now that we have all of our logs centralized we just need to ship those logs to our SIEM. My guide will be using winlogbeats and creating a pipeline into SecurityOnion2 but if you wanted to use Splunk for example, you would just need to install the forwarder here.
Configuring Winlogbeats
Now that we are seeing host logs centralized, we need to configure Winlogbeats to ship those logs into our SIEM SecurityOnion2. There are a couple caveats to keep in mind.
1
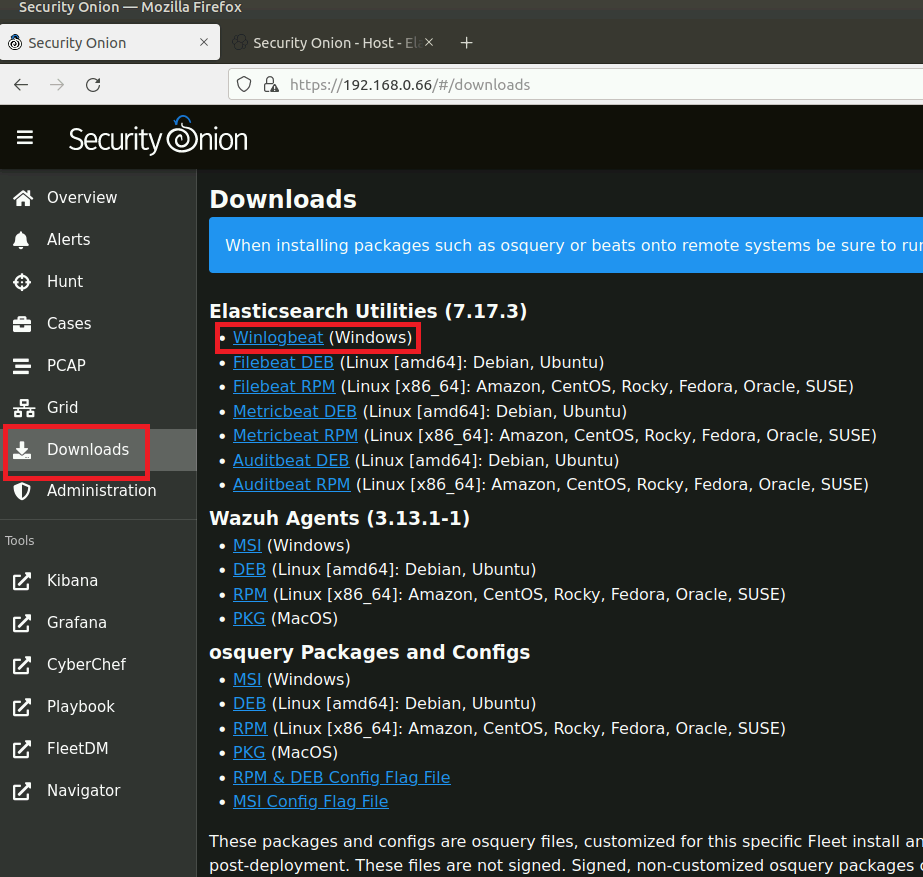
1. Caveat number 1 is that you will need to download the exact verion of Winlogbeat supported by the version of SecurityOnion2 that you're using. To do this, you can log into the SOC and from the downloads page download the correct version. Then you will just need to push this .msi file to your WEC.
1
2
3
**QUICKNOTE** You can only ship logs to SecurityOnion2 in either a Standalone or Distributed deployment.
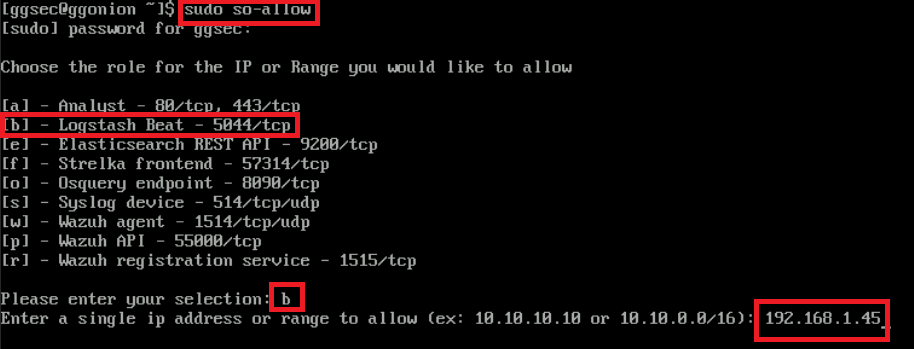
2. Caveat number 2 is that you will need to login to your SO2 manager and open up the firewall so that logs can be sent to your SIEM. This can be done with the following commands where x.x.x.x is your WEC's IP address.
1
    sudo so-allow
1
    b
1
    x.x.x.x
Now that we have prepped our deployment we can get started. On your WEC run the .msi file you downloaded earlier from your SO2 instance. During the initial install you can keep all the defaults and once it finishes you can now edit your winlogbeatreference.yml file located in
1
C:\Program Data\Elastic\Beats\winlogbeat\
I highly recommend using a proficient editor like notepad ++ as you will be making a couple of edits to this file.
1
1. First you will want to make sure that setup.dashboards.enabled setting is commented out.
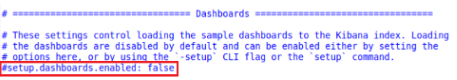
1
2. Next you will want to disable the output.elasticsearch field by also commenting it out.

NOTE: Don’t make the same mistake I did. In order for this setup to work properly you will need to make sure taht you can route the traffic coming from your WEC into the Mangaement Interface of your SO2 manager. Usually this involves creating a static route on the firewall/switch where your WEC is and making sure it points to the same network as your SO2 management interface is. You can do a quick sanity check to see if it will work beforehand by typing the following command in powershell on your WEC where x.x.x.x si your SO2 management IP interface address.
1
Test-netconnection -ComputerName "x.x.x.x" -Port 5044
1
The above will tell you if a connection can be established over that port. If you see anything but a success, make sure the so-allow rule wen through and check your routing.
Once you’ve fininshed making your changes to the winlogbeatsreference.yml file save it as a new file, naming it something appropriate and put it in the following directory where x.x.x is the version of winlogbeat you have installed.
1
C:\Program Files\Elastic\Beats\x.x.x\winlogbeat\
You will then want to make sure that this service starts automatically incase of a sudden reboot. Type the following in a Powershell prompt with administrative rights where x.x.x is your version of winlogbeats and y is the new forked file you just created.
1
New-Service -Name "Winlogbeats" -BinaryPathName "C:\Program Files\Elastic\Beats\x.x.x\winlogbeat.cmd -c y.yml -e"
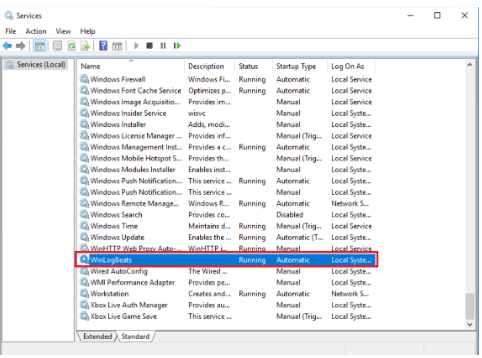
Lastly you will want to go into your services and enable the new service. It should start and you should now be seeing host logs in your SecurityOnion2 instance. If you receive an error while starting this service, you probably aren’t point to the right reference file. ILf you aren’t seeing data being ingested and the service is working, make sure you have data being forwarded into your WEC and make sure you can still touch the Manager.
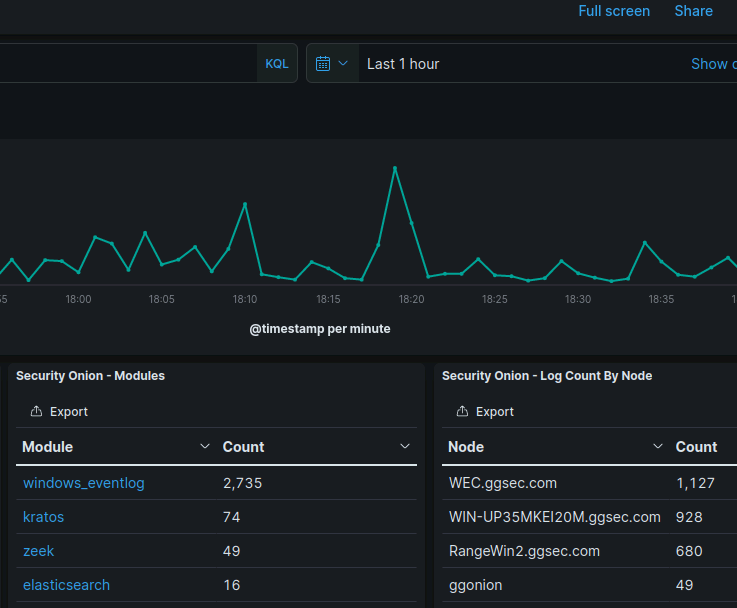
You will know you’re successfully ingesting host logs when you log into your SOC and you see log counts from your nodes in your domain.
END
Thanks for making it this far! There are still some minor adjustments you may want to make in the future such as utilizing syslog and forwarding logs that aren’t domain joined. Maybe I’ll revisit these topics in a later blog post. If you have any questions or want some troubleshooting help feel free to reach out via email, as I’m always willing to try. Have a great rest of your day!